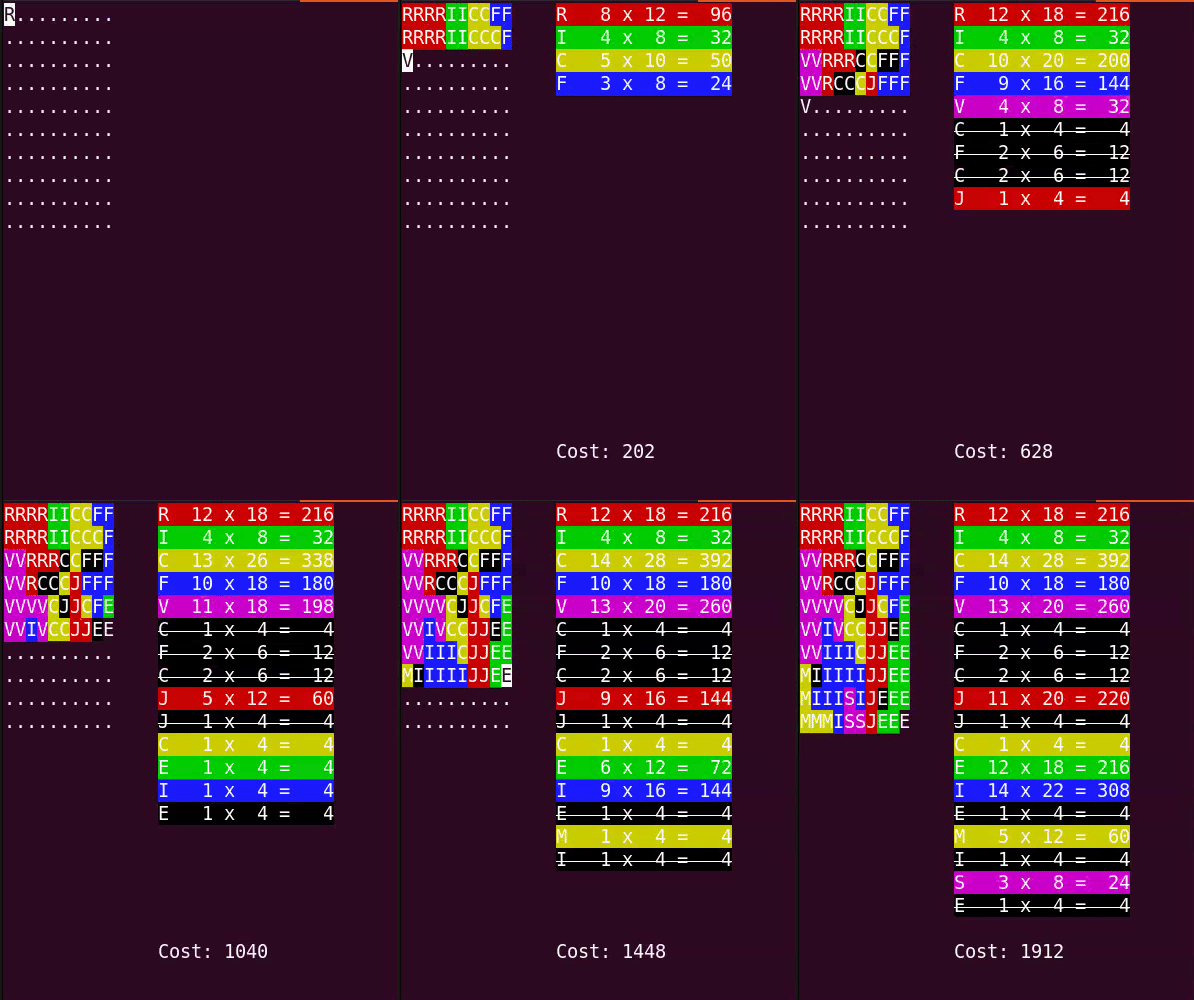
My solution visualization:

My solution visualization:

The puzzle looks much like a flood fill algorithm, so I’ve picked one (2023, Day 18) and reworked it. Addition: each time you enter a cell that is invalid (another plant, or outside the map), it’s a fence, so for part 1 you count it.
For part 2 I was about to do a data structure which was too complicated and error prone (the fences’ perspective) and the voice from the clouds (“dude, don’t overcomplicate!”) and some déformation professionnelle helped me to have a simpler one: look at each cell of the map like a spreadsheet cell where you can set borders on each side. When you try to enter an invalid cell, mark the border in the originating cell.
When the flood fill is done, you compute the rebate for the horizontal fences, then for the vertical ones. A bug I had was to compute the rebate during the flood fill, which was too complicated and sometimes wrong: you undercount sometimes the aligned fences.
My approach:
I started off with a Vector of Vectors of Plot info (plot type, a region number, open sides). I’ll slang call it a 2D vector. Additionally I kept a hashed map of lists of plot coordinates (X,Y) which were all in the same region (so each key was an assigned region ID and the element was a vector of plot coordinates to reference the 2D vector)
I first read the file in initializing the plot type for all elements.
After that, I looped through the 2D vector looking at each upper and left neighbor’s assigned region if they had the same plot type.
After that, I just iterated through the plots using the region hash map to calculate the number of exposed sides per plot, the perimeter (sum of sides for the region), and the area (number of elements in that region’s list)
I basically implemented a crude form of edge detection and walked the outermost edge with some rules for counting turns. After looking at some other solutions I see I totally lost the plot on this one. Could be a cool visualization though, maybe I’ll hack one up later.
I solved part 1 pretty easily. Every step (up, down, left, right) which leads to another crop letter adds 1 to the perimiter. Computing the areas was a flood fill, which I implemented by walking the matrix, and merging adjacent areas. That seemed the easiest thing to do.
I started a bit late on part 2, puzzled a bit, then thought I could adapt my part 1 solution by not adding to the perimiter when there was a fence in the previous cell, but that failed. No idea why.
The rebates for the bulk discount have to be computed after the flood fill. Otherwise you’ll miss some of them, sometimes. I did the same mistake…
@Max That’s cool, but I don’t understand the strikeouts. I guess they’re somehow related to part 2?
Reading most solutions here and on Reddit, it looks as if everyone does Part 1 the same. (Possibly excepting Max.)
For Part 2 I think I did the same thing as some have described above, but since mine “looks” a little different in my head: once I finish “flood-filling” a region with BFS, identifying fence pieces according to boundary or difference in plot, I iterate through its fence pieces, identifying which ones are on the same side by walking along it. To handle the wrinkle in Part 2 I computed which side the fence piece was facing, and made sure that I only added fence pieces that faced the same side.
On Reddit they describe another approach, which I had thought of but discarded as surely too obvious: count corners. Feeling kind of silly for not pursuing that.
I construct regions by adding one cell at time. It could be that when I add a next cell it joins two disjoined regions in one. In this case I increase one of them and eliminate another one by setting its area to be zero. To visualize this situation I draw one of these region in black and strike it out in the table after elimination.