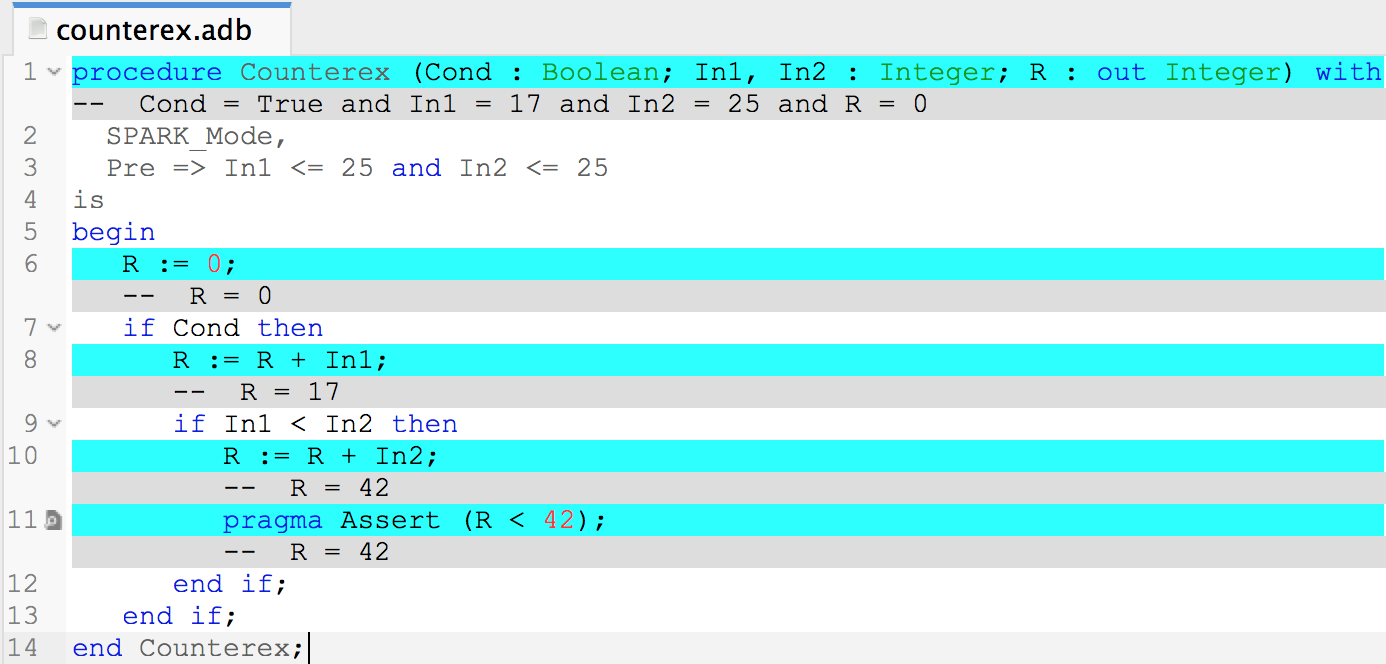
This nice trace only seems to work inside GNAT Studio, not inside the VSCode AdaCore.ada plugin. Is there a way to output this trace to a text console (e.g. by passing an option to the gnatprove command-line command) so that this trace feature can be used outside GNAT Studio?
I am unsure whether I correctly understood your question, but lets give it a try.
If you are referring to having the same nice comments inlined with the counter example that you show in your screenshot, I believe that only GNATStudio can do that. However, if you would like to have the same feature in VSCode, I would recommend that you open an issue in its repository and ask for the feature. I think this could be a very nice feature to have indeed!
On the other hand. If want you want is to have the counter examples given in the output of a terminal when running gnatprove, I think you can just get it when using the correct flags. The link you provided shows a couple of examples of this behaviour. Though it is true that the output may not be as pretty nor as complete.