Hello,
I suspect there’s a CPU usage inefficiency somewhere in my program. I could try to resolve it by inspecting the code or adding diagnostic printouts, but does anyone have a smarter way to approach this? Yes, I use Ada ![]()
reinert
Hello,
I suspect there’s a CPU usage inefficiency somewhere in my program. I could try to resolve it by inspecting the code or adding diagnostic printouts, but does anyone have a smarter way to approach this? Yes, I use Ada ![]()
reinert
Have you looked into using a program profiler? I don’t normally use them myself though, so I can’t suggest a specific one. I would avoid printing output right away since that adds its own overhead. One method I’ve used is to collected timing data into a buffer and print the result after the code of interest has executed.
What platform are you on? (embedded, Linux, Windows, etc?) It depends a lot on the platform you’re running, but there are a lot of options.
The known expert with methods on how to do this is Brendan Gregg.
I have never gone deep into profiling and debugging performance of programs. However, here are a few tools that I have used:
perf is closely related to DTrace, which you can use in Solaris/BSD systems (and Linux too nowadays).callgrind tool to get a good understanding of what your callgraph looks like and what is taking so much memory and time. It is quite easy to use. You can use your application directly on it without having to recompile it with special flags or fancy things. There are some GUI applications to analyze the data, such as kcachegrind. I also supports cooperation with GDB to find nasty bugs quite easily see this small article. See this article for simple points, recommendations and usage (focus on the performance point).perf and can debug single applications without requiring any special things. See examples for how to use it.I hope this helps,
Fer
OK, here is how I do this, which is pretty common when implementing numeric stuff.
The first step. I do not use any tools. They are too coarse to be useful. You would get a heap of useless information to browse through, while what you need is a focused analysis of suspicious pieces of code, usually executed in a loop. So I start with a broad scope and then iteratively narrow it around the offending part(s). What I use is rather simple Ada code that I insert at the places I suspect.
Here it is (it uses Simple Components, but you could rewrite it of course):
with Ada.Calendar;  use Ada.Calendar;

with Tables;

package Profiler is

   type Element is record
      Total : Duration := 0.0;
      Count : Natural  := 0;
      Start : Time;
   end record;

   package Element_Tables is new Tables (Element);
   use Element_Tables;

   Statistics : Table;

   procedure Enter (Item : String);
   procedure Leave (Item : String);
   procedure Reset (Item : String);
   procedure Report;

   pragma Inline (Enter);
   pragma Inline (Leave);

end Profiler;
The implementation:
with Ada.Text_IO;            use Ada.Text_IO;
with Strings_Edit;           use Strings_Edit;
with Strings_Edit.Integers;  use Strings_Edit.Integers;

package body Profiler is

   procedure Enter (Item : String) is
      Offset : Integer := Locate (Statistics, Item);
   begin
      if Offset > 0 then
         declare
            This : Element := GetTag (Statistics, Offset);
         begin
            This.Start := Clock;
            Replace (Statistics, Offset, This);
         end;
      else
         declare
            This : Element;
         begin
            This.Start := Clock;
            Replace (Statistics, Item, This);
         end;
      end if;
   end Enter;

   procedure Leave (Item : String) is
      Offset : Integer := Locate (Statistics, Item);
   begin
      if Offset > 0 then
         declare
            This : Element := GetTag (Statistics, Offset);
         begin
            This.Total := This.Total + (Clock - This.Start);
            This.Count := This.Count + 1;
            Replace (Statistics, Offset, This);
         end;
      end if;
   end Leave;

   procedure Reset (Item : String) is
      Offset : Integer := Locate (Statistics, Item);
   begin
      if Offset > 0 then
         declare
            This : Element := GetTag (Statistics, Offset);
         begin
            This.Total := 0.0;
            This.Count := 0;
            Replace (Statistics, Offset, This);
         end;
      end if;
   end Reset;

   procedure Report is
      Line    : String (1..120);
      Pointer : Integer := 1;
   begin
      Put (Line, Pointer, "                        Called");
      Put (Line, Pointer, "     Average, s");
      Put (Line, Pointer, "     Times");
      Put (Line, Pointer, "       Total, s");
      Put_Line (Line (1..Pointer - 1));
      for Item in 1..GetSize (Statistics) loop
         Pointer := 1;
         declare
            This : Element := GetTag (Statistics, Item);
         begin
            Put
            (  Destination => Line,
               Pointer     => Pointer,
               Value       => GetName (Statistics, Item),
               Field       => 30,
               Justify     => Right
            );
            if This.Count = 0 then
               Put (Line, Pointer, " -");
            else
               Put
               (  Destination => Line,
                  Pointer     => Pointer,
                  Value       => Duration'Image
                                 (This.Total / This.Count),
                  Field       => 15,
                  Justify     => Right
               );
               Put
               (  Destination => Line,
                  Pointer     => Pointer,
                  Value       => This.Count,
                  Field       => 10,
                  Justify     => Right
               );
               Put
               (  Destination => Line,
                  Pointer     => Pointer,
                  Value       => Duration'Image (This.Total),
                  Field       => 15,
                  Justify     => Right
               );
            end if;
            Put_Line (Line (1..Pointer - 1));
         end;
      end loop;
   end Report;

end Profiler;
The usage is straightforward:
   ...
   Enter ("Suspect 1");
   ... -- The code I suspect
   Leave ("Suspect 1");
   ...
and before exiting the program you call Report,
I use linux/debian.
reinert
Thanks, I’ll give it a try. Also good to know for next time!
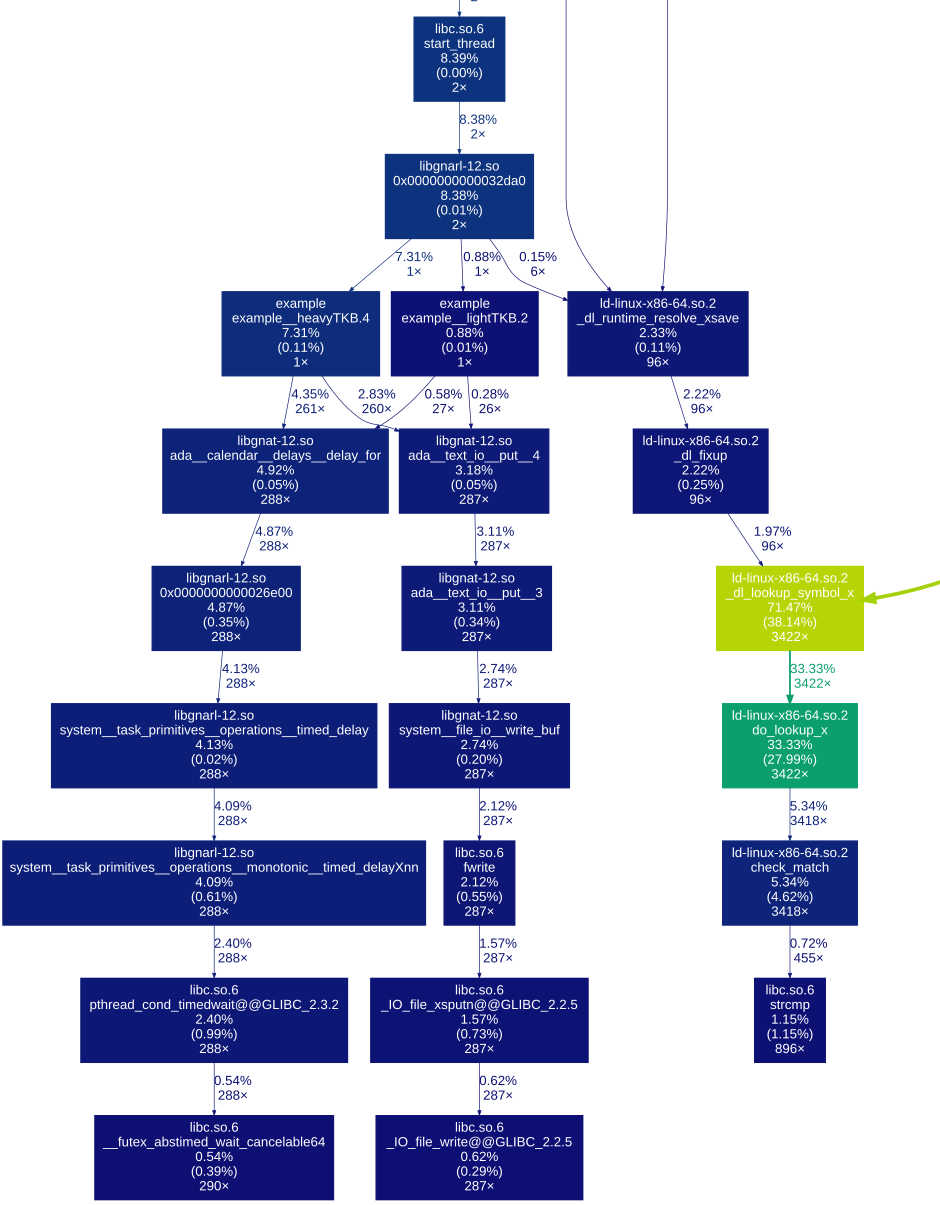
I have used Valgrind with the callgrind tool and gprof2dot [1] to generate a callgraph diagram.
For instance:
with Ada.Text_IO; use Ada.Text_IO;

procedure Example is
   task Heavy;
   task Light;

   task body Heavy is
   begin
      loop
         delay 0.1;
         Put (".");
      end loop;
   end Heavy;

   task body Light is
   begin
      loop
         delay 1.0;
         Put("+");
      end loop;
   end Light;
begin
   Put ("Example Started");
end Example;
Valgrind Profile Step:
> valgrind --tool=callgrind ./example
Diagram Generation:
> gprof2dot.py -f callgrind callgrind.out.12345 | dot -Tsvg -o example.svg
Example callgraph diagram (cropped):
[1] GitHub - jrfonseca/gprof2dot: Converts profiling output to a dot graph.
![]()
![]()
Have you ever had the problem that “Report” can change the code’s behavior and thus performance; e.g., a context switch for that function, and/or threading? I think I’ve used something like that before, and while it works, it was a problem for me; I was using threaded C++ code, but it’s been at least 5 years since I was doing that, so I may misremember. (In particular, I may have been using this technique to debug, rather than optimize.)
There’s a guy on StackOverflow who used to recommend this method: compile your program with debug symbols, then interrupt it while it’s running in gdb. Make a note of the stack trace, then resume execution, then interrupt it again, and again make a note of the stack trace. Keep doing this several times. The function(s) that show up most often in your stack trace are the ones where you have to spend time in optimization.
You might be interested in the following presentation given at one of the Ada Developer Rooms at FOSDEM about how the team at Eurocontrol addresses this problem in their core applications:
Tracking Performance of a Big Application from Dev to Ops
(includes video recording and slides)
Performance analysis is not meant for tasking. It is for finding algorithmic issues and optimization.
If you have deadlocks, livelocks, priority inversions, disbalanced services etc. profiling is little or no help.
For Intel CPU the best is
valgrind might be useful sometimes too
Please define the meaning of this term.
You can easily do it yourself. Consider the optimal complexity of a given problem. Then the CPU time required for this complexity. Inefficiency is derivation from that value.
And of course everybody has an intuitive understanding of a slow program. Sometimes wrong sometimes right.
“Slower than expected” is my pragmatic approach ![]()
So you “suspect” that your program is slower than expected?
That could be a possible interpretation ![]()