Hello,
I’ve come across a stack overflow issue with a debug version of the embedded-stm32f429disco runtime and I am trying to understand if I’ve got a corrupt memory on my board or there is something else going on.
Consider the following simple task spec and body (which doesn’t actually do anything useful):
with System;
package usart_tasks2 is

   task type Test_Type with Priority => System.Max_Priority;

   TT : Test_Type;

end usart_tasks2;
package body usart_tasks2 is

   task body Test_Type is
      M_A : Integer := 0;
   begin
      loop
         M_A := (M_A + 1) rem 100;
      end loop;
   end Test_Type;

end usart_tasks2;
Now running this on an actual board traps immediately and after a bit of tracing in gdb I’ve come to the conclusion that the elaboration of the above task is causing the overflow.
Below are some screenshots of the tracing (please, keep in mind I am compiling with -fstack-check):
Starting from start-rom.s I put a breakpoint in adainit right before the elaboration is run:
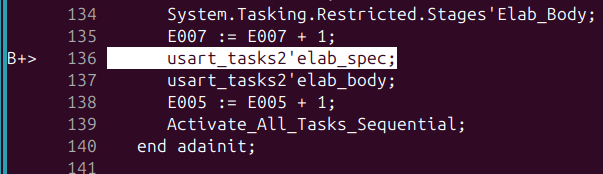
and then I put another one in
Stack-Check whose call I believe is put in place by the compiler due to -fstack-check: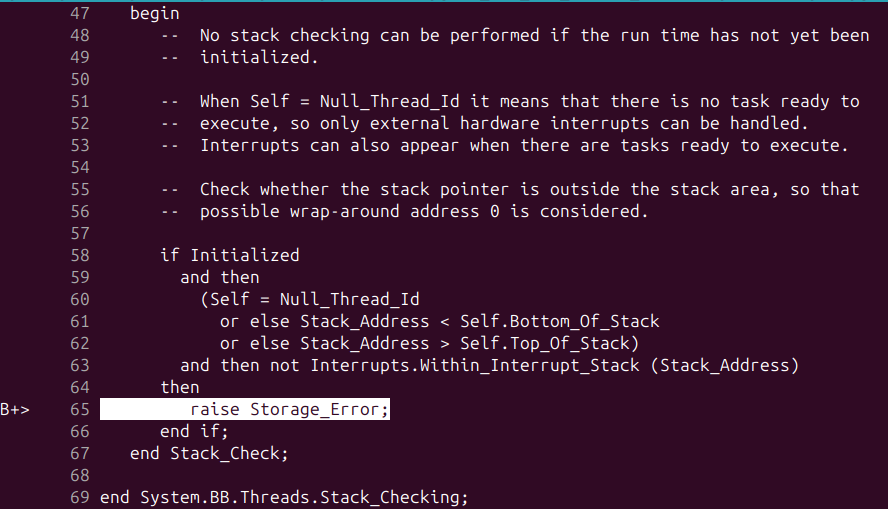
so it’s clear that the elaboration code is somehow overshooting the stack.
The actual address values can be seen below:
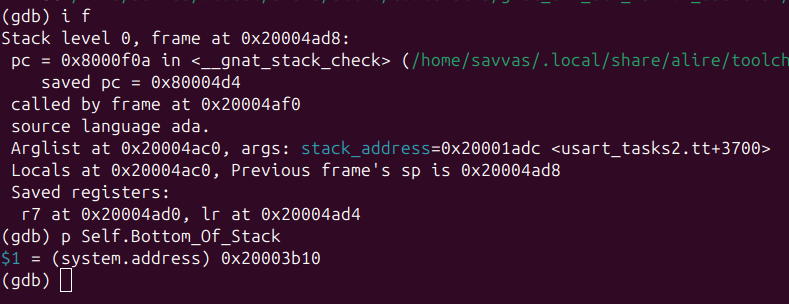
where clearly
stack_address (in the printed Arglist) is way below Bottom_Of_Stack (cortex m4s are (full) descending).I’m not entirely sure how stack boundaries per-task are calculated but I assume each task is given a starting stack address and a (configurable) size and that
Bottom_Of_Stack refers to the overall stack boundary calculated in the linker script? I.e. __stack_start here:
Any ideas what might be causing this? The only things declared are a
main and the above task package where there are no complex declarations in the elaboration section. Could that be some memory corruption issue? 
Thanks!